
3-Month Update: Are We Still on Track for a Crash?
It’s been 3 months since I last published: Given that the stock, property, and commodities markets are at an all-time high, I think it’s appropriate to do a check-in.

Hello friends,
It’s been 3 months since I last published:

Given that the stock, property, and commodities markets are at an all-time high, I think it’s appropriate to do a check-in.
Quick Recap
Last time, I talked about some warning signs:
S&P 500 at all-time highs
Sky-high P/E ratios
The “Magnificent 7” are dominating everything
Weak consumer sentiment
Falling housing market confidence
I gave three scenarios:
1. 45% chance: Growth continues, then crashes
2. 20% chance: Fed cuts rates, saves the day
3. 35% chance: Fed triggers the crash
Given that the growth has continued and the Fed has started cutting rates (scenarios 1 and 2), let’s revisit these numbers—and look at some new ones—to see where we stand.
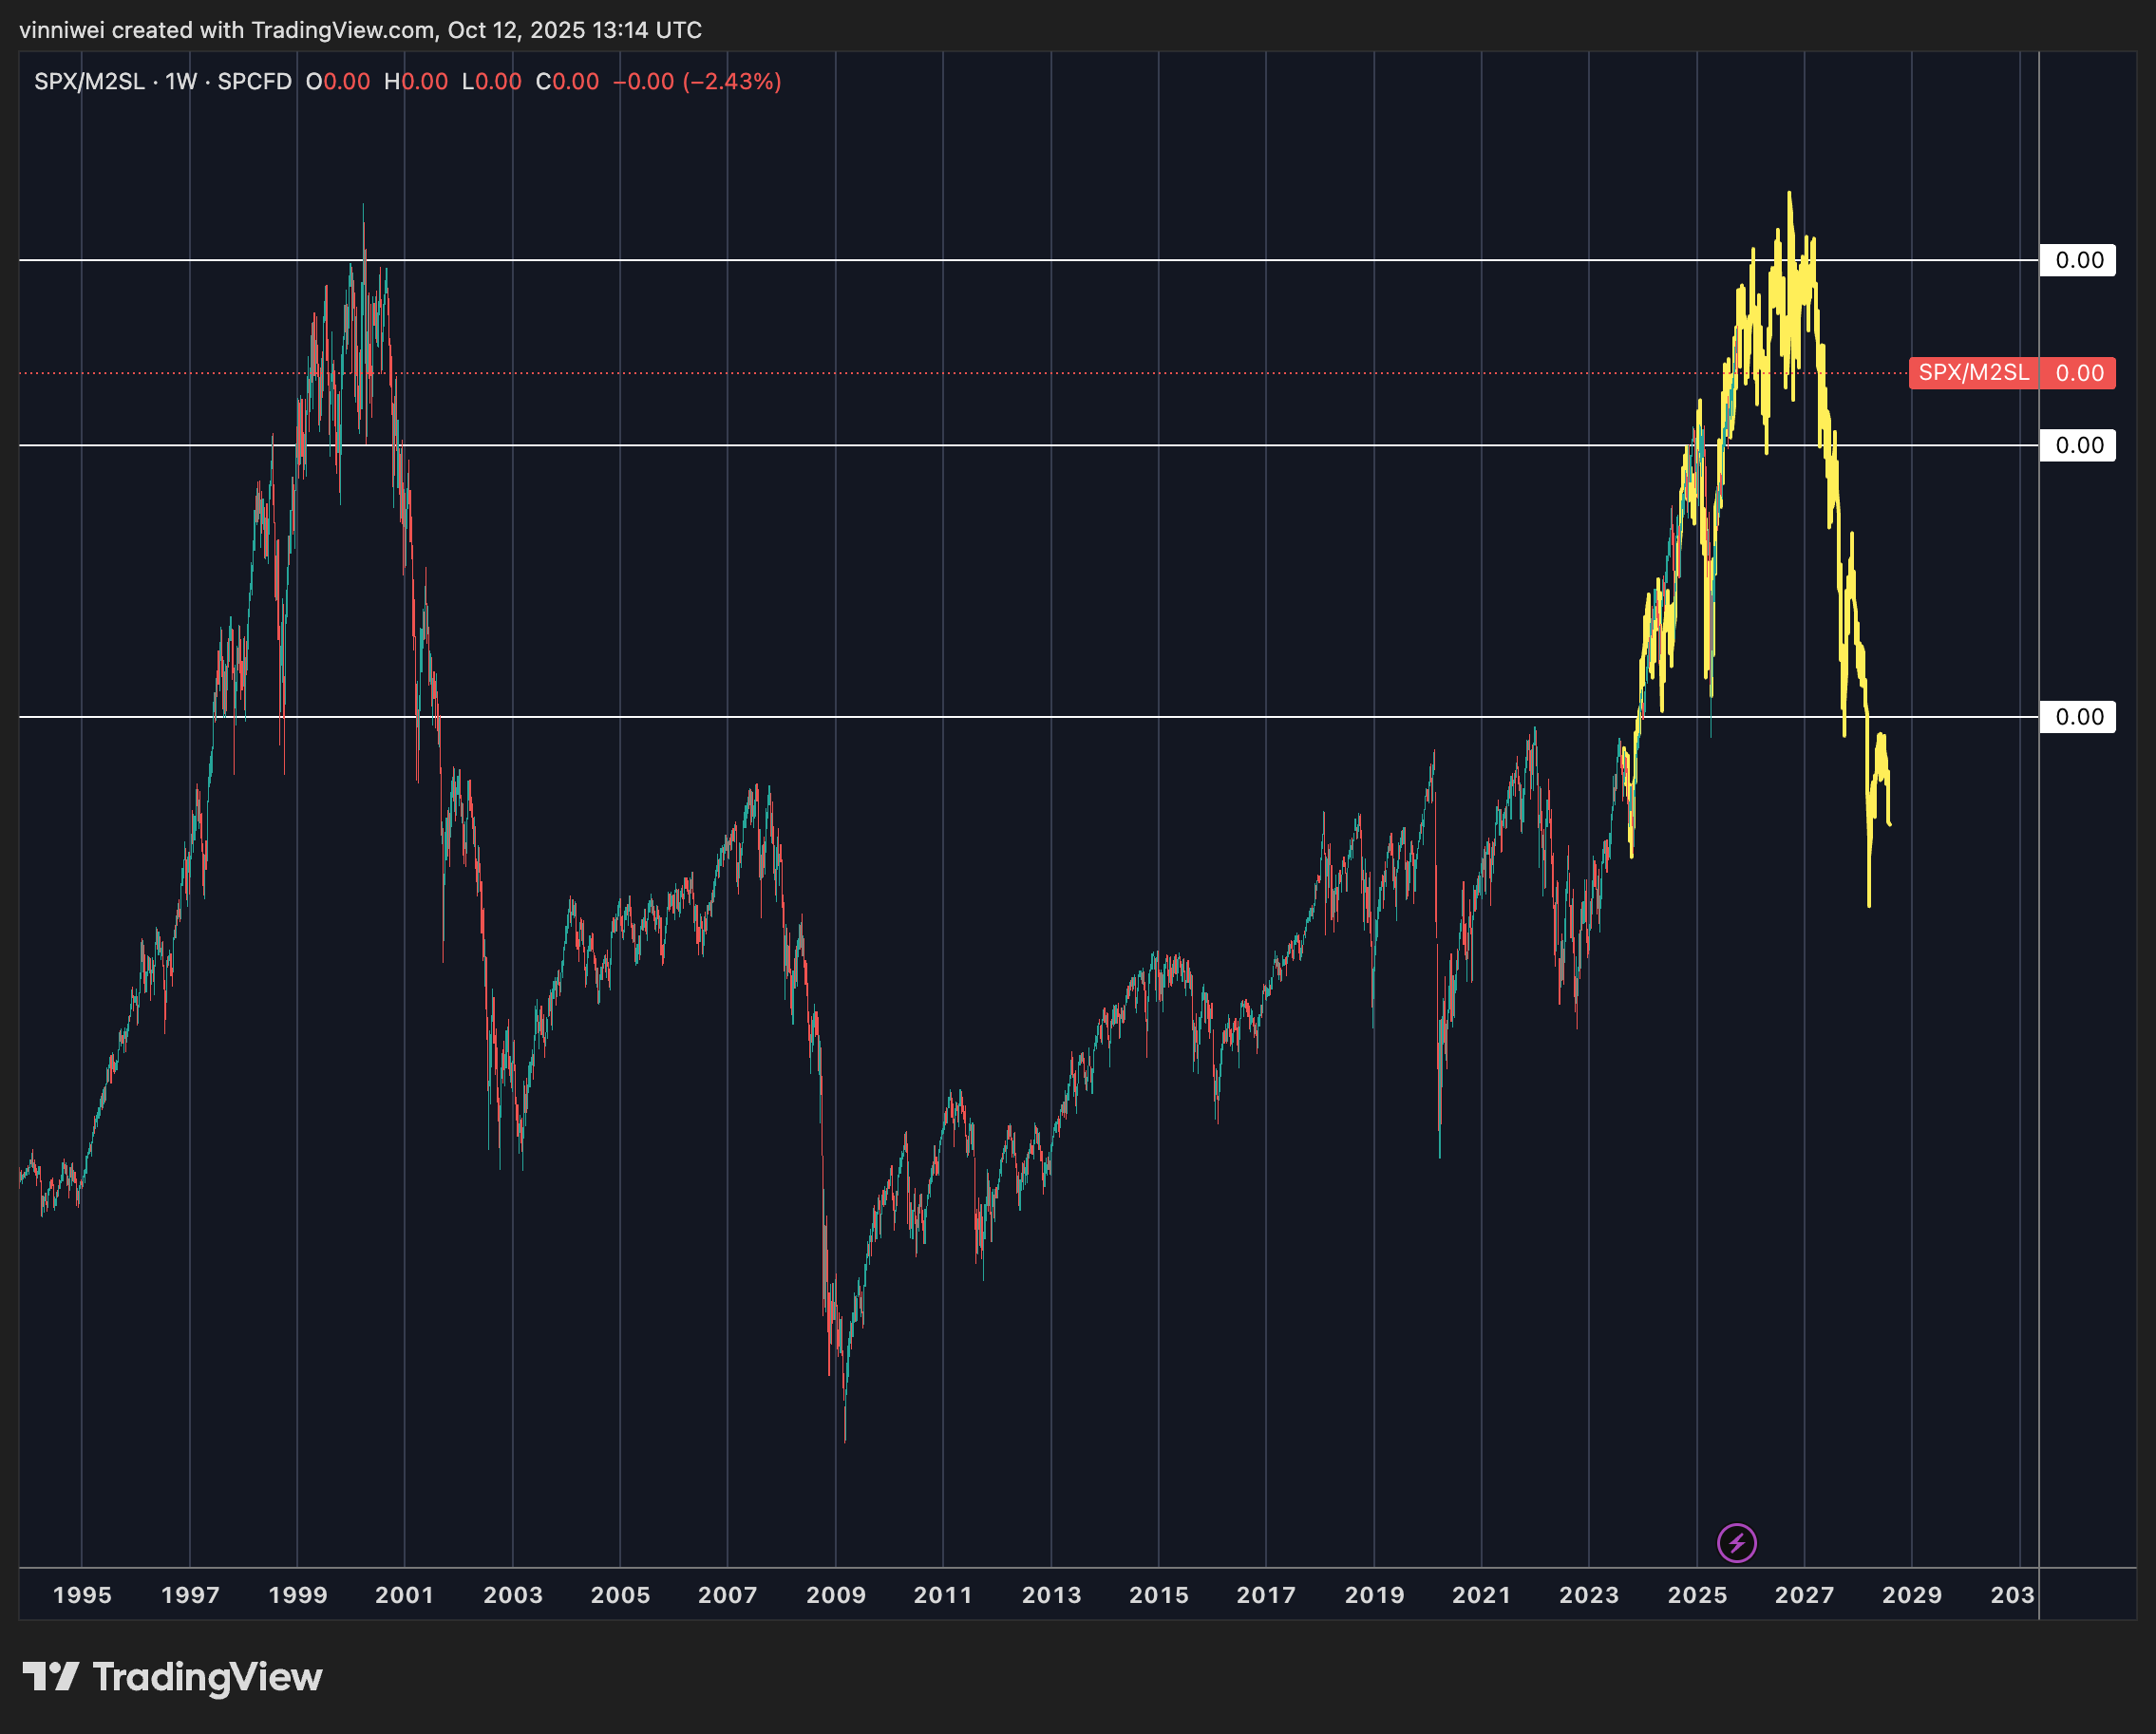
1. S&P 500 denominated in M2
Remember our chat about the Dot Com parallels? Last quarter’s S&P 500 kept right on that track—the similarities are still pretty striking!
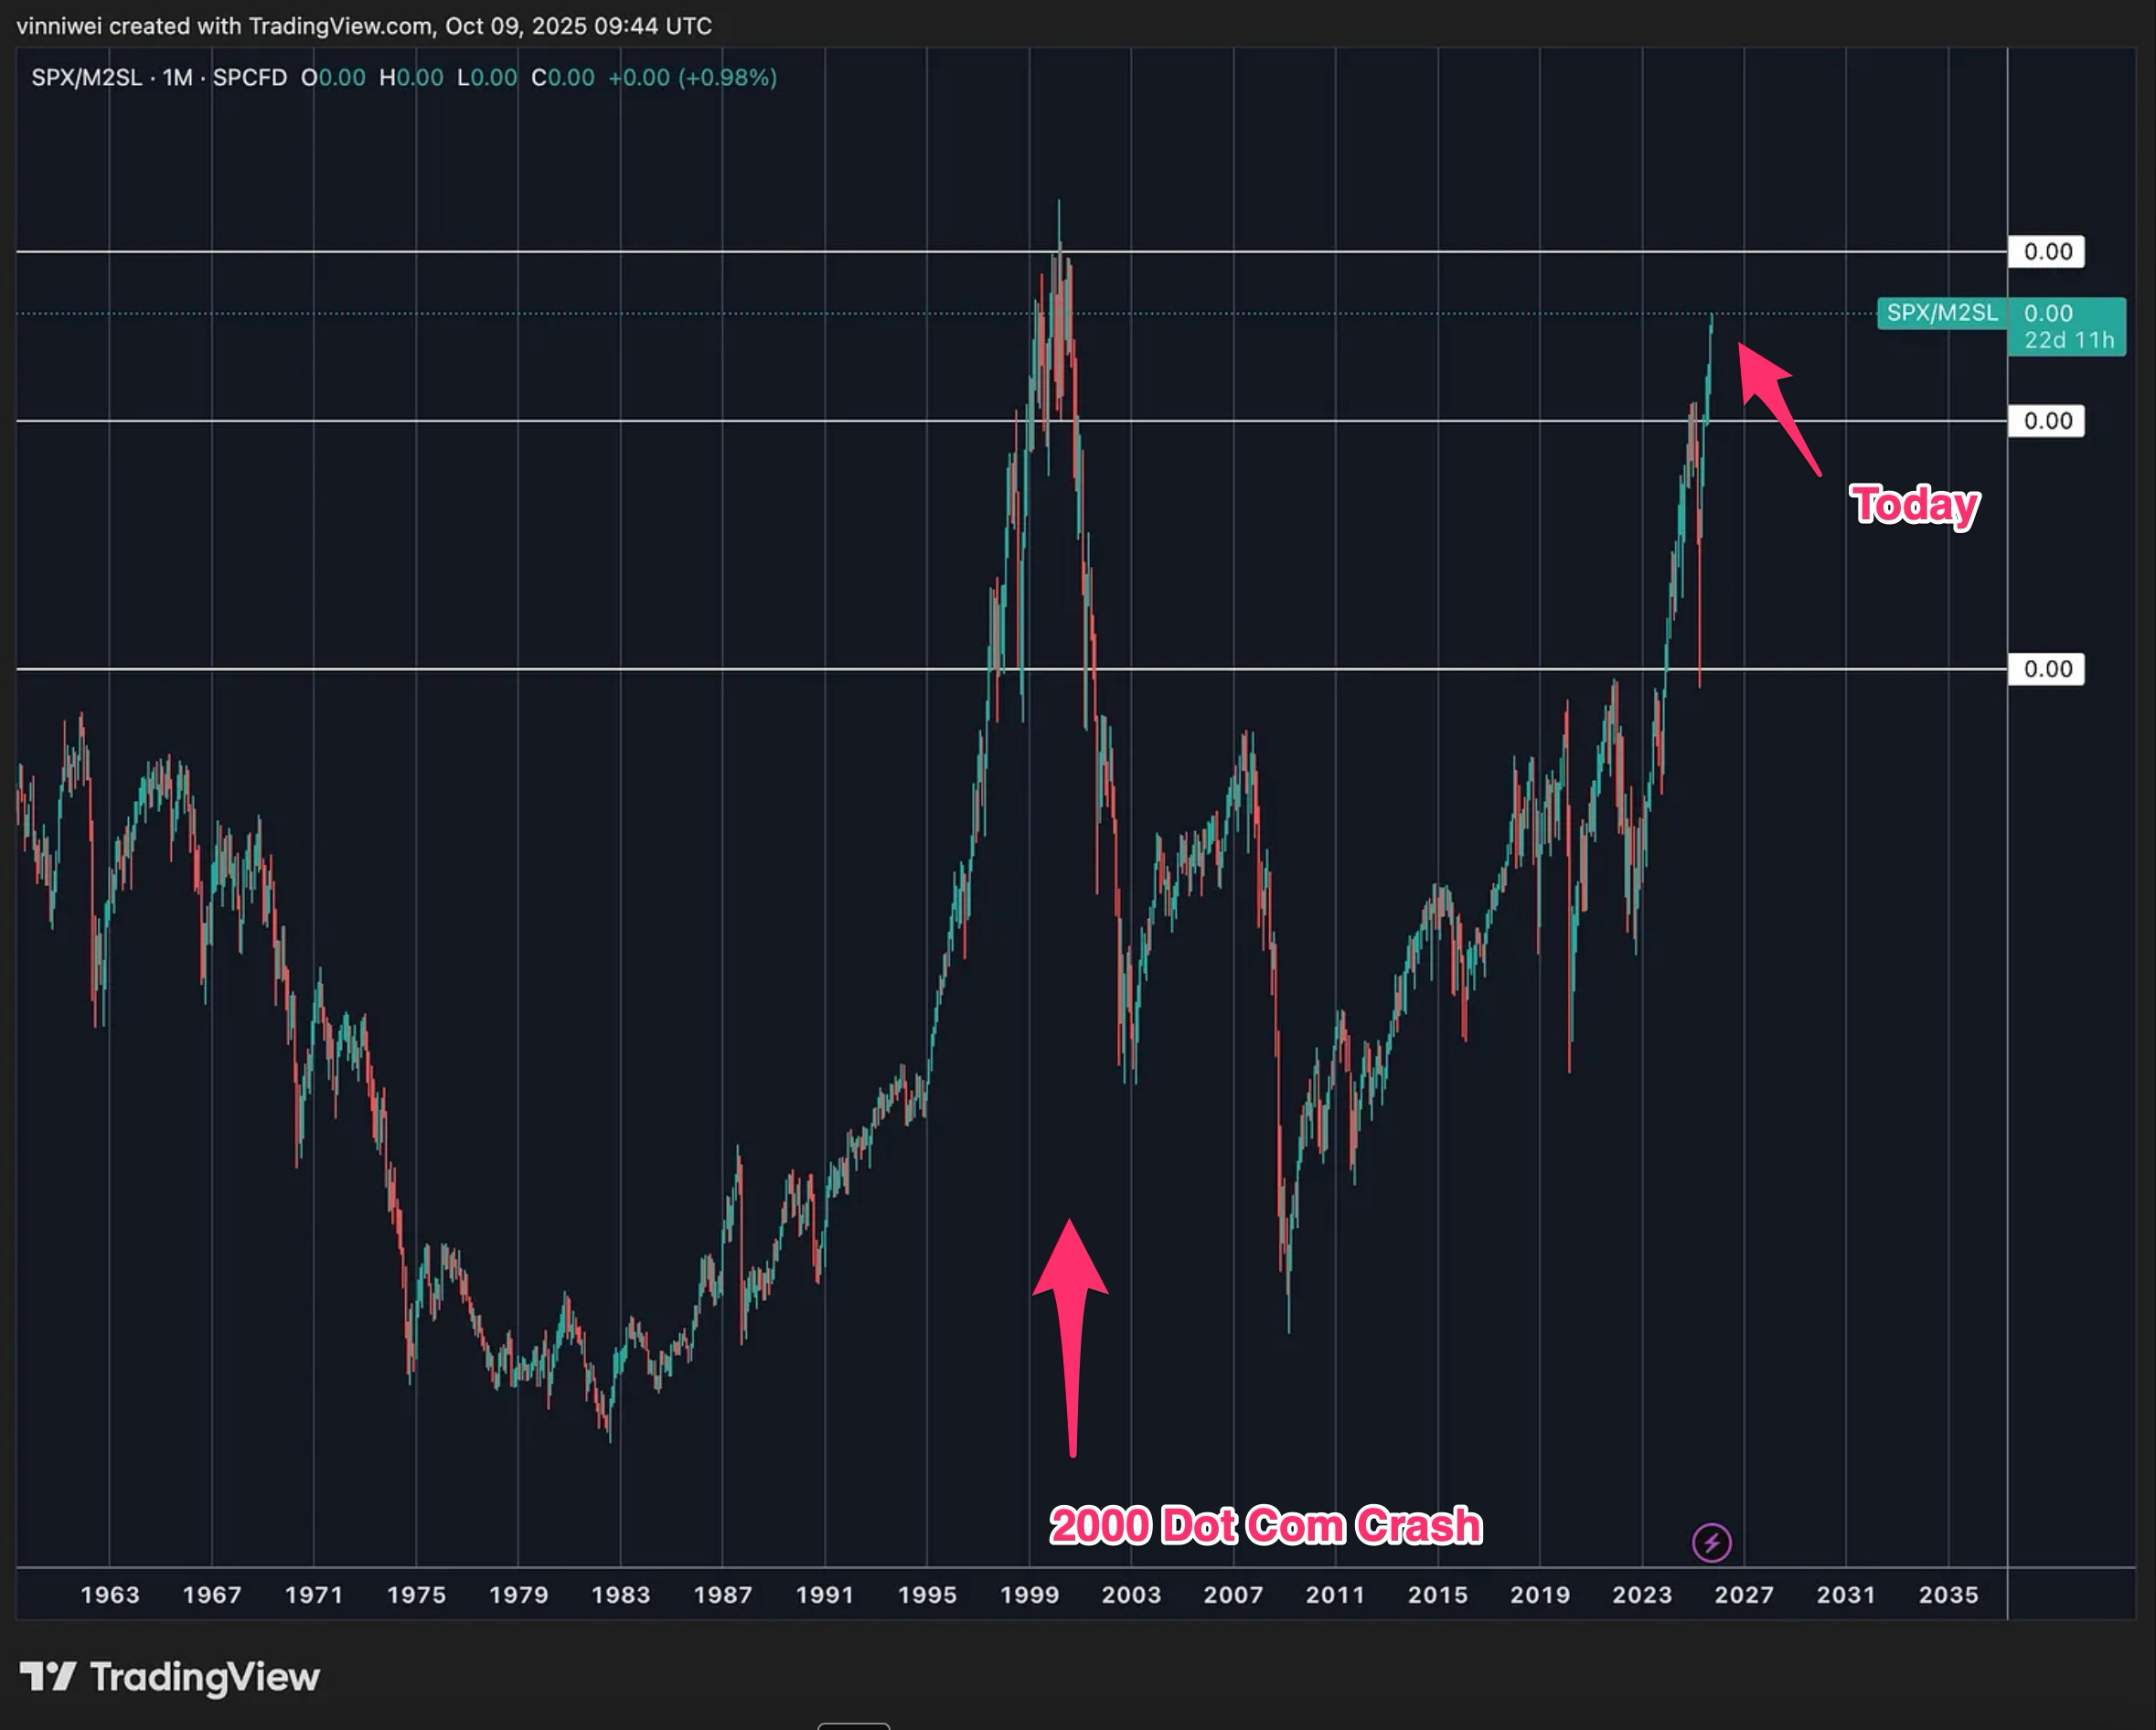
Back in 2000, everyone was hyped about internet companies. Today? It’s AI, robotics, and microchips. History doesn’t repeat, but it rhymes. And we’re right at that all-time resistance high.
Now here’s where it gets interesting. Here are a few thoughts I have:
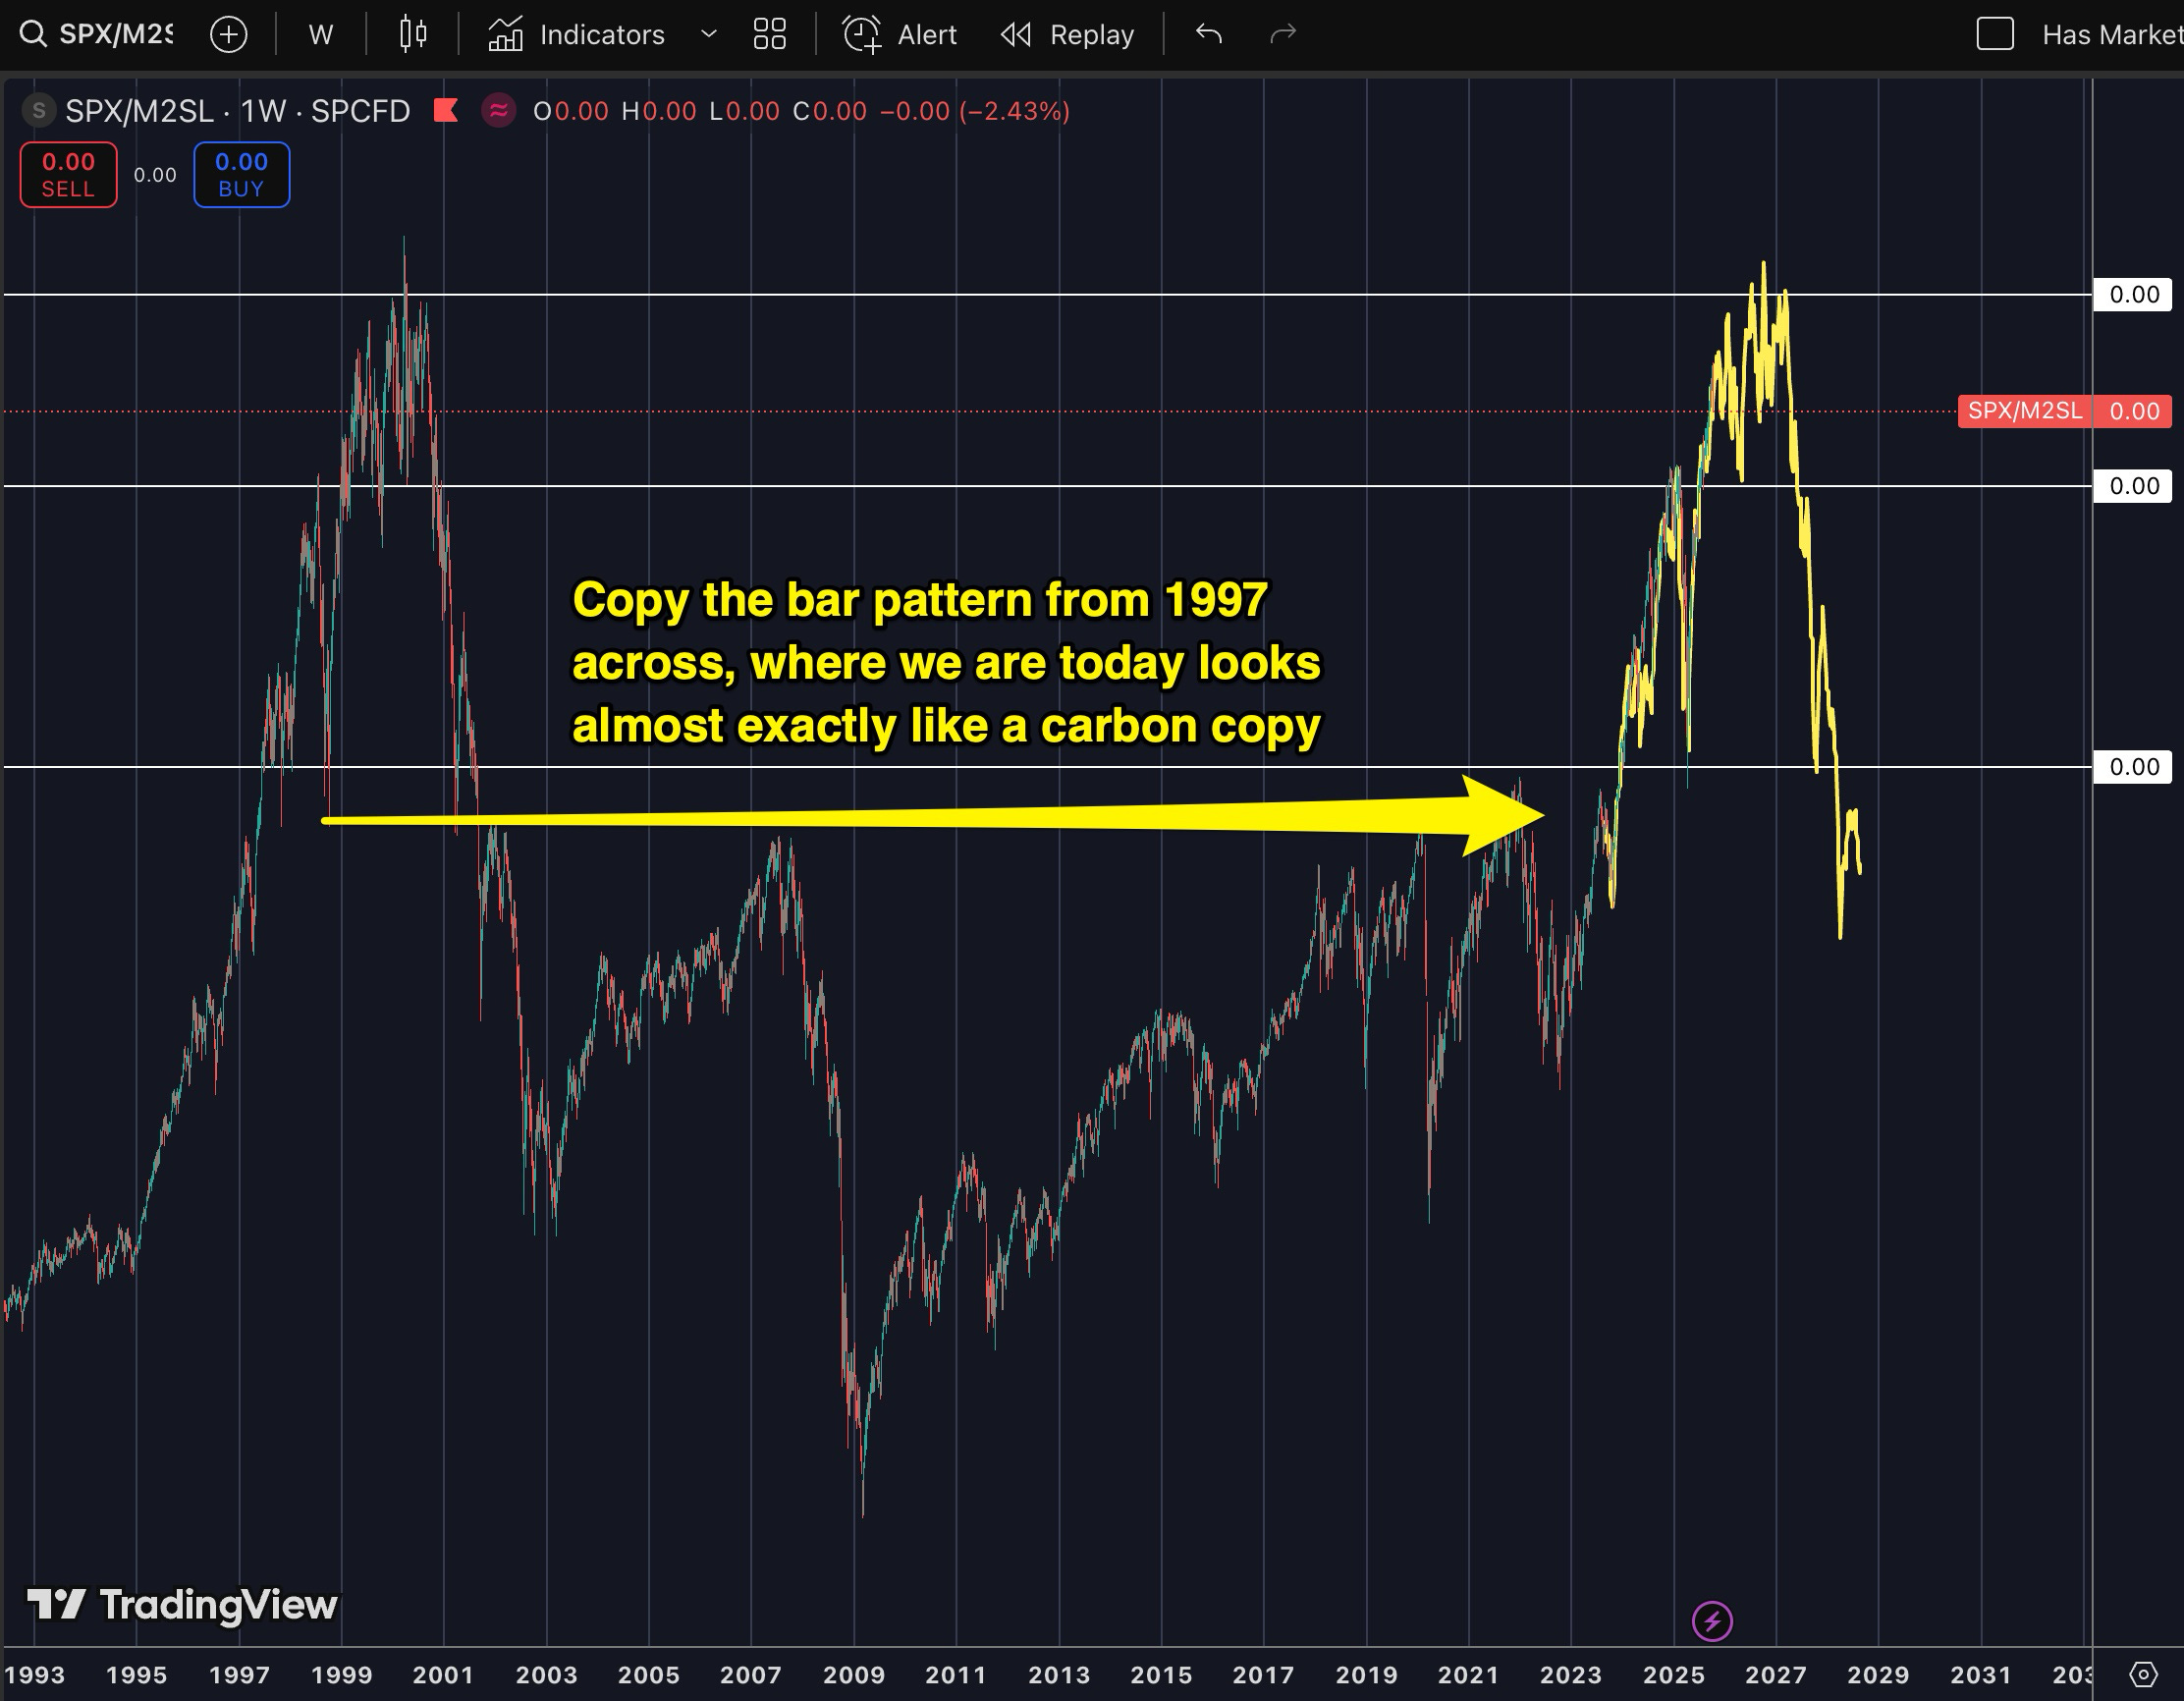
History repeats: If we follow the Dot Com pattern starting from 1997, we’d see that where we are today looks almost like a carbon copy. If the pattern continues to rhyme, a likely scenario is that we will see some correction between July 2026 and early 2027.

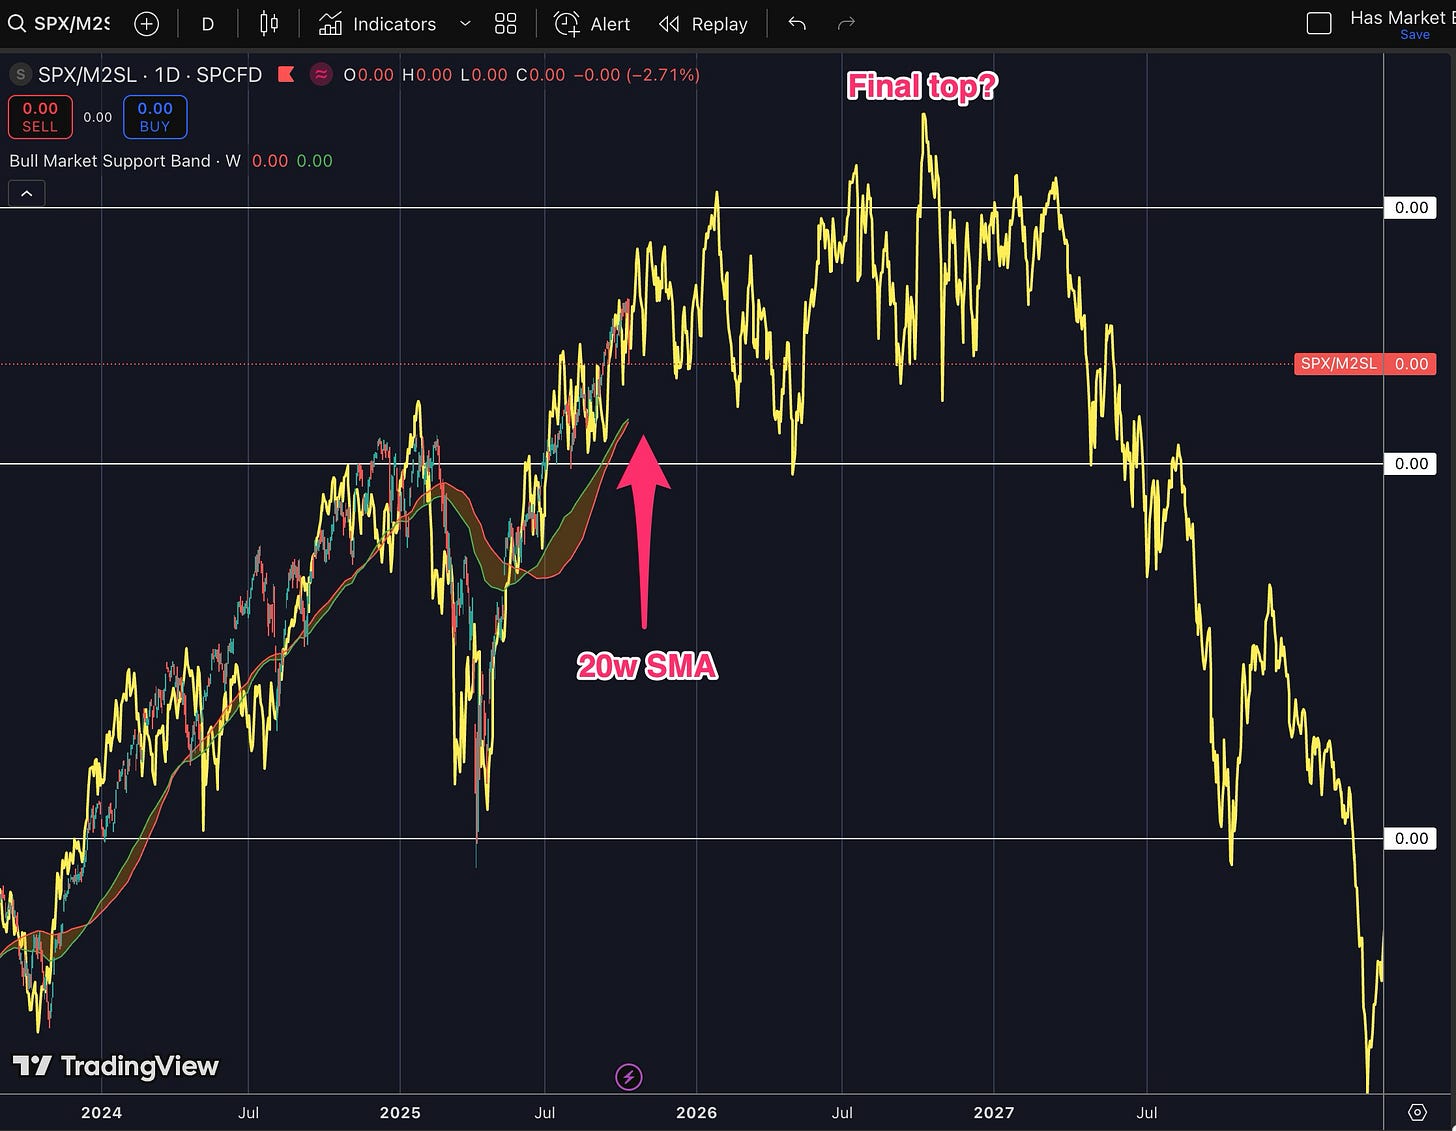
Increase volatility: Focusing in, we can see if this comparison is valid; there will be an increase in volatility ahead. Today SPX dropped 3% (10th of Oct 2025 closing). I think it is likely that it’ll touch the 20-week SMA support (corresponding to a 5% drop) and perhaps more volatility along the way on its way to the final top.
This time is different(?): The S&P 500 in 2000 had Pets.com burning cash. Today? NVIDIA does $131B revenue with 50% profit margins. Amazon does $638B in revenue—more than Microsoft’s entire 2000 market cap. These aren’t vaporware companies—they’re printing money. It’s probable to say that the S&P today is made up of better companies that increase productivity and efficiency more than those in the past. Leveraging new technology, AI, and talent, it is also possible to expect SPX/M2 to break higher this time.

What I’m watching: Are these companies actually making revenue from AI, robotics (and others), or are the revenue sources still the same, and investors are paying for what could be? That’s the real test. If AI revenue is real and growing, we could break higher. If it’s just hype on top of old business models, well... patterns rhyme.
Ask yourself, what is the risk you are taking, vs. the return you think is left on the table and over what time period?
The risk is definitely higher compared to two years ago.
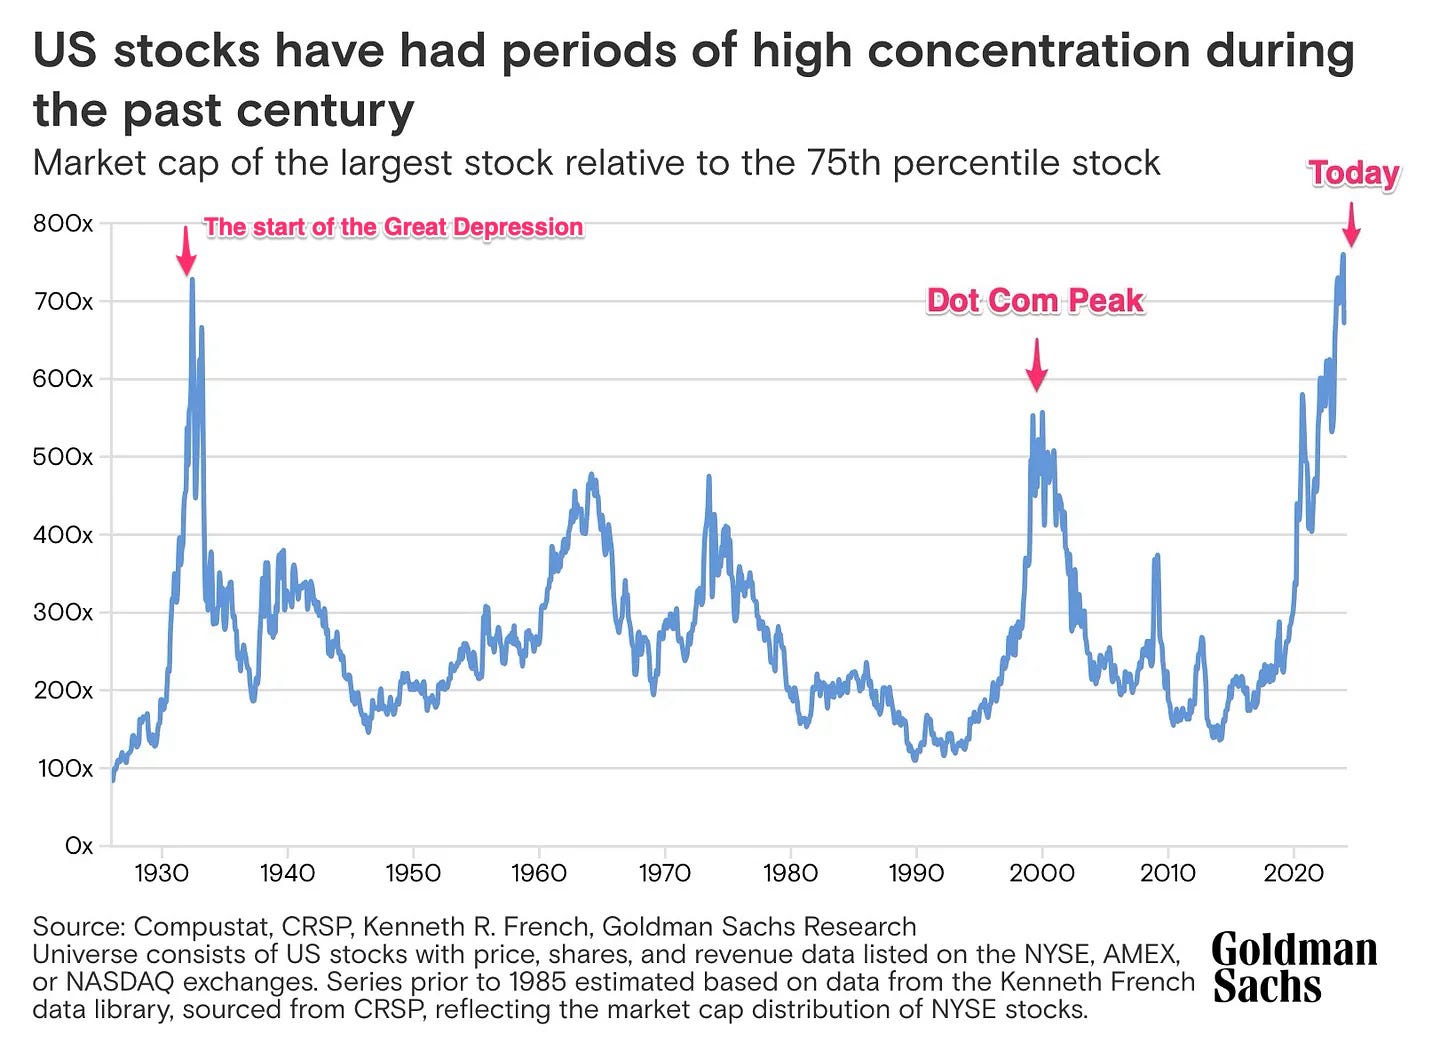
2. S&P Concentration
The top 10 companies now control 43% of the S&P 500. In 1999, the top 10 controlled just 23%.
Market concentration has nearly doubled.
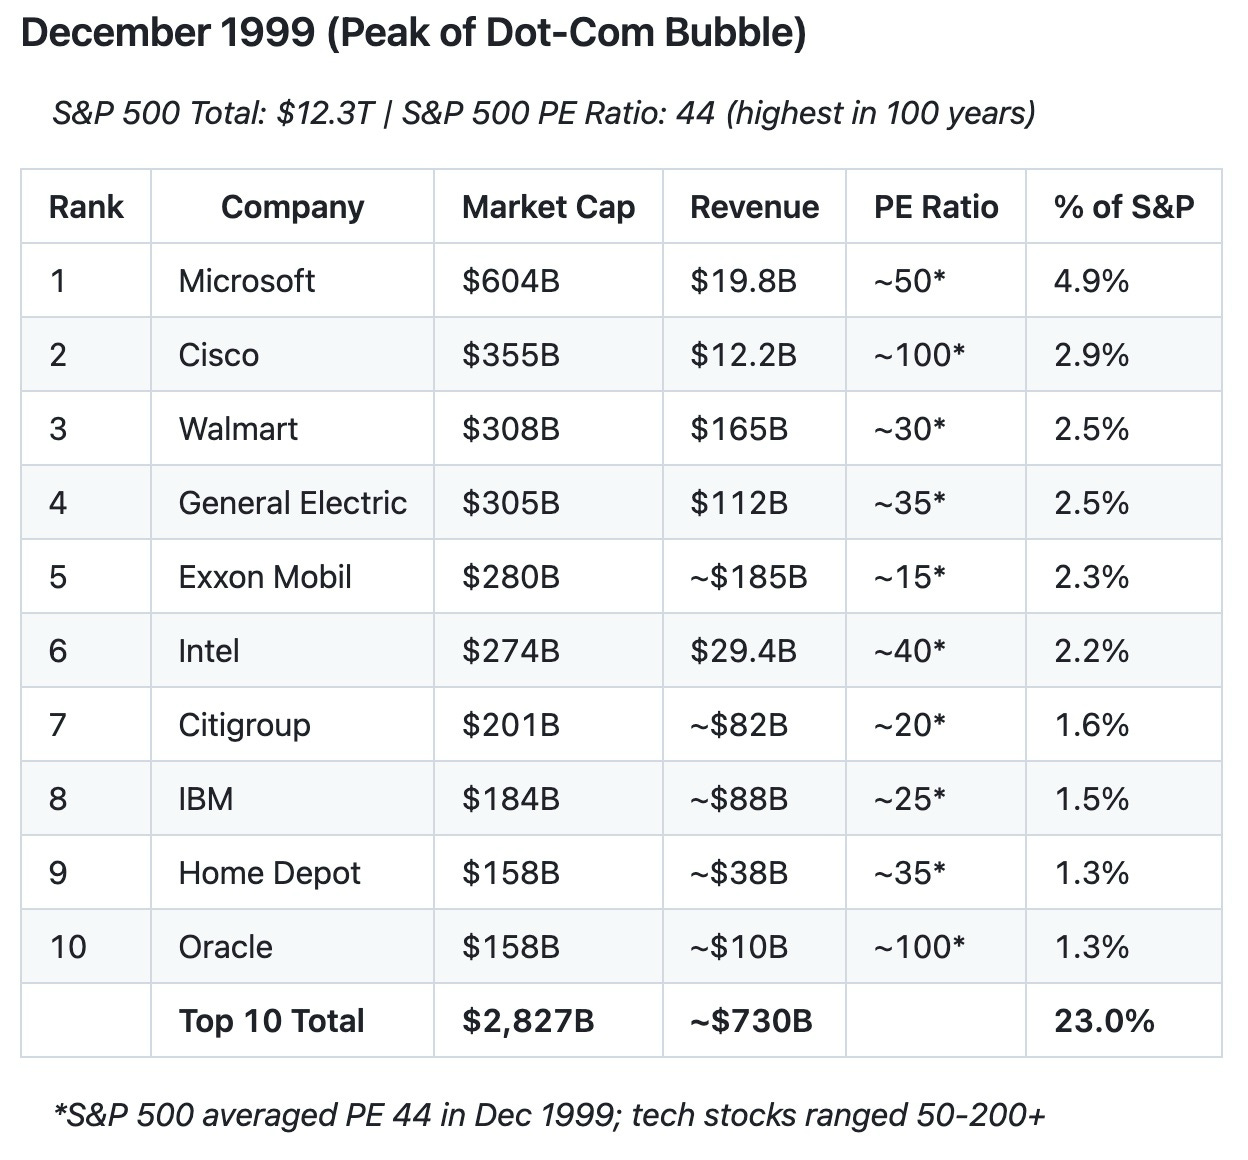
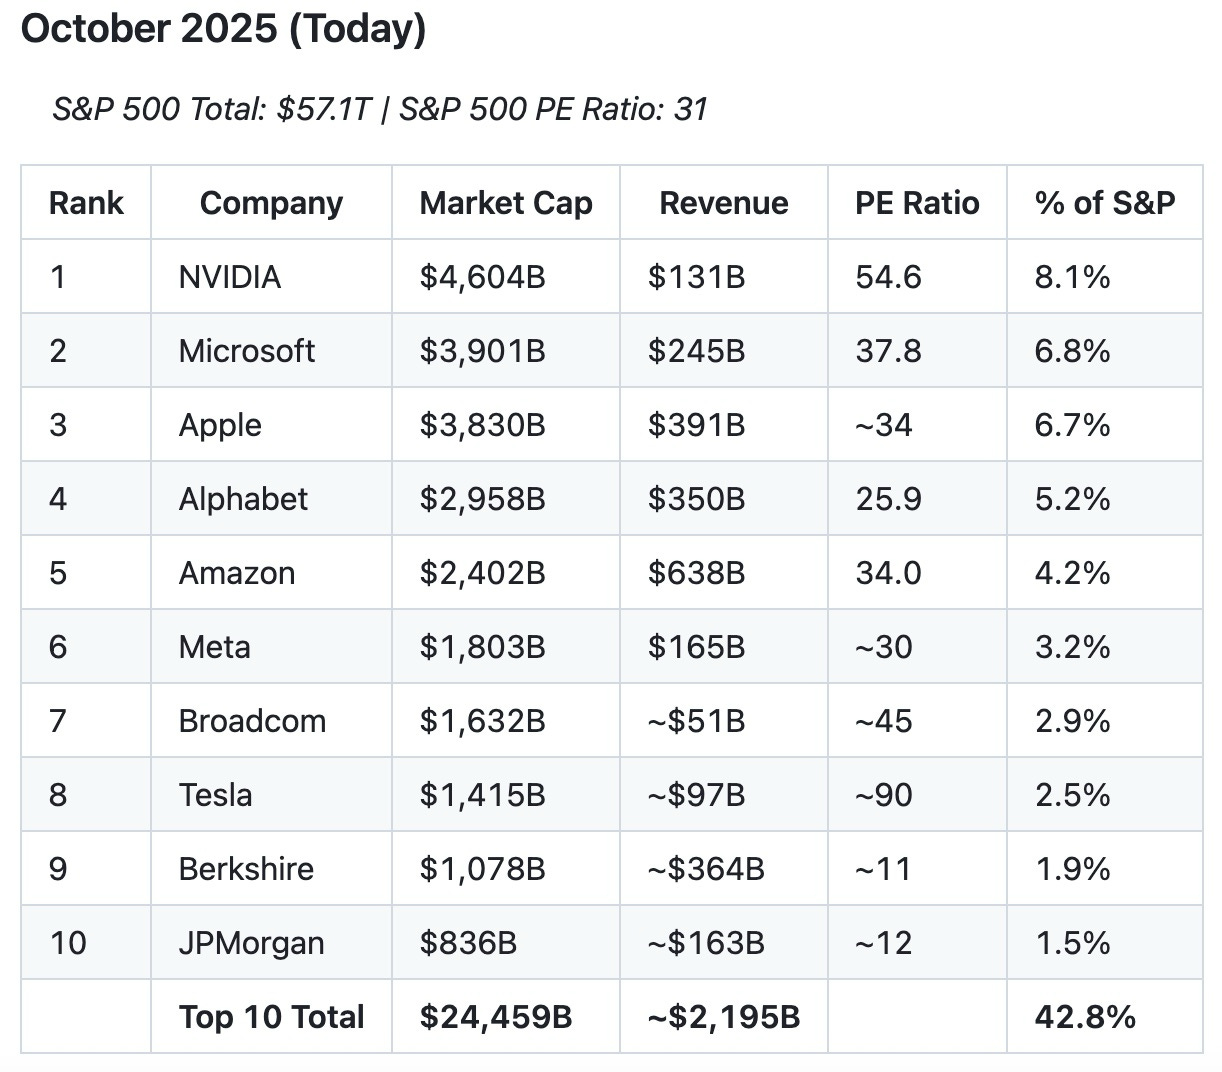
This is an increase from 39% since the start of the year, making this the highest concentration ever in the history of S&P.
While 42.8% is an all-time high, it actually makes sense for top companies today to have higher concentrations because of the network effect and economies of scale created by leveraging technology.
I think this graph tells a good story of the make-up of SPX and where we are, but not necessarily a good predictor of market tops.
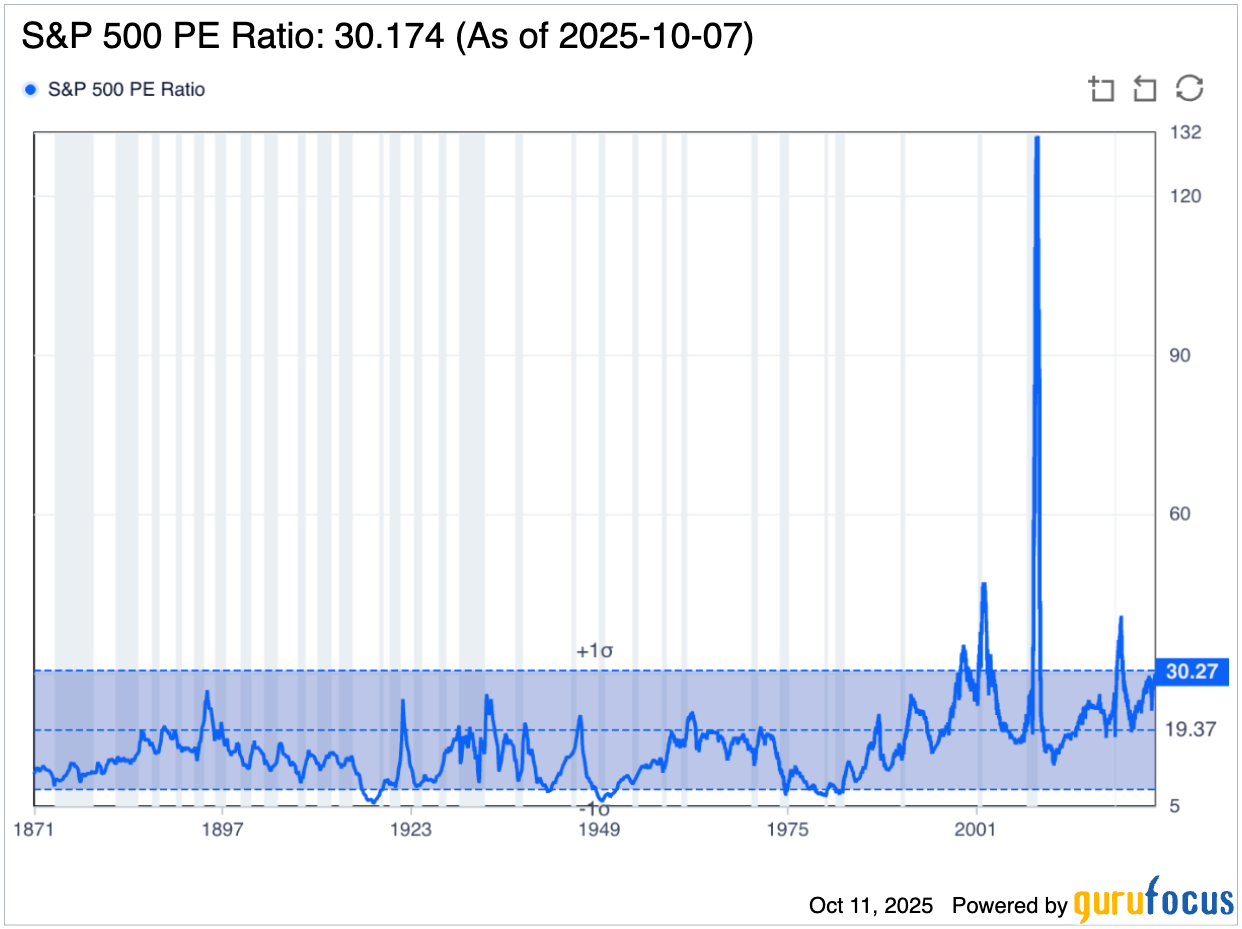
3. P/E Ratio and Future Returns
The price-to-earnings ratio (P/E ratio) was also something we visited last quarter. Compared to a quarter ago, it’s increased from 28 → 30. We continue our approach to +1 sigma.
Lesson from last post: “1 sigma” means there’s about a 16% chance the P/E would be this high or higher just by random luck. That’s not common!
Last time, I didn’t talk about why the P/E ratio matters beyond just “expensive” or “cheap.”
Here’s why it matters: P/E ratio predicts your future returns.
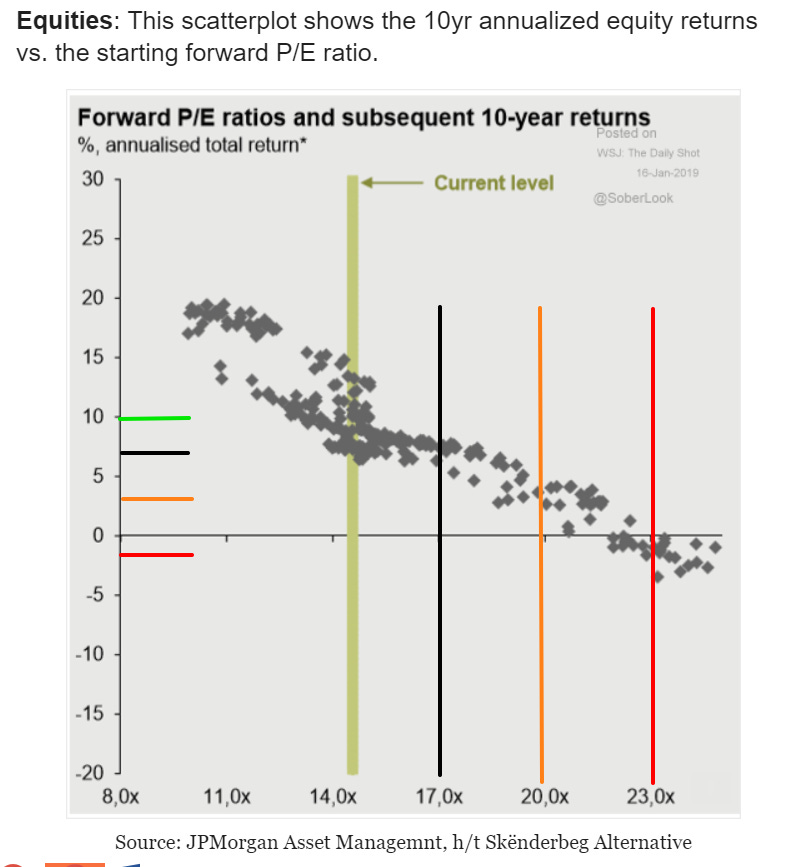
Look at the right chart. See that downward slope? Every dot is a moment in time since 1988.
When P/E was low (left side), the next 10 years delivered 15-20% annual returns. When
P/E was high (right side), returns dropped to 0-5% annually, or worse.
Where are we now? P/E today is at ~30, beyond the red bar on the right.
Sure, the market can likely go higher. But history says: zero to negative single-digit returns over the next decade… I’m not sure I want to take that bet for maybe a little bit more upside.
Modelling this back to the Dot Com Crash, you can see that if you’ve bought at similar levels to now, it would take you 7 years of watching your portfolio bleed to briefly break even (before experiencing the 2008 crash).
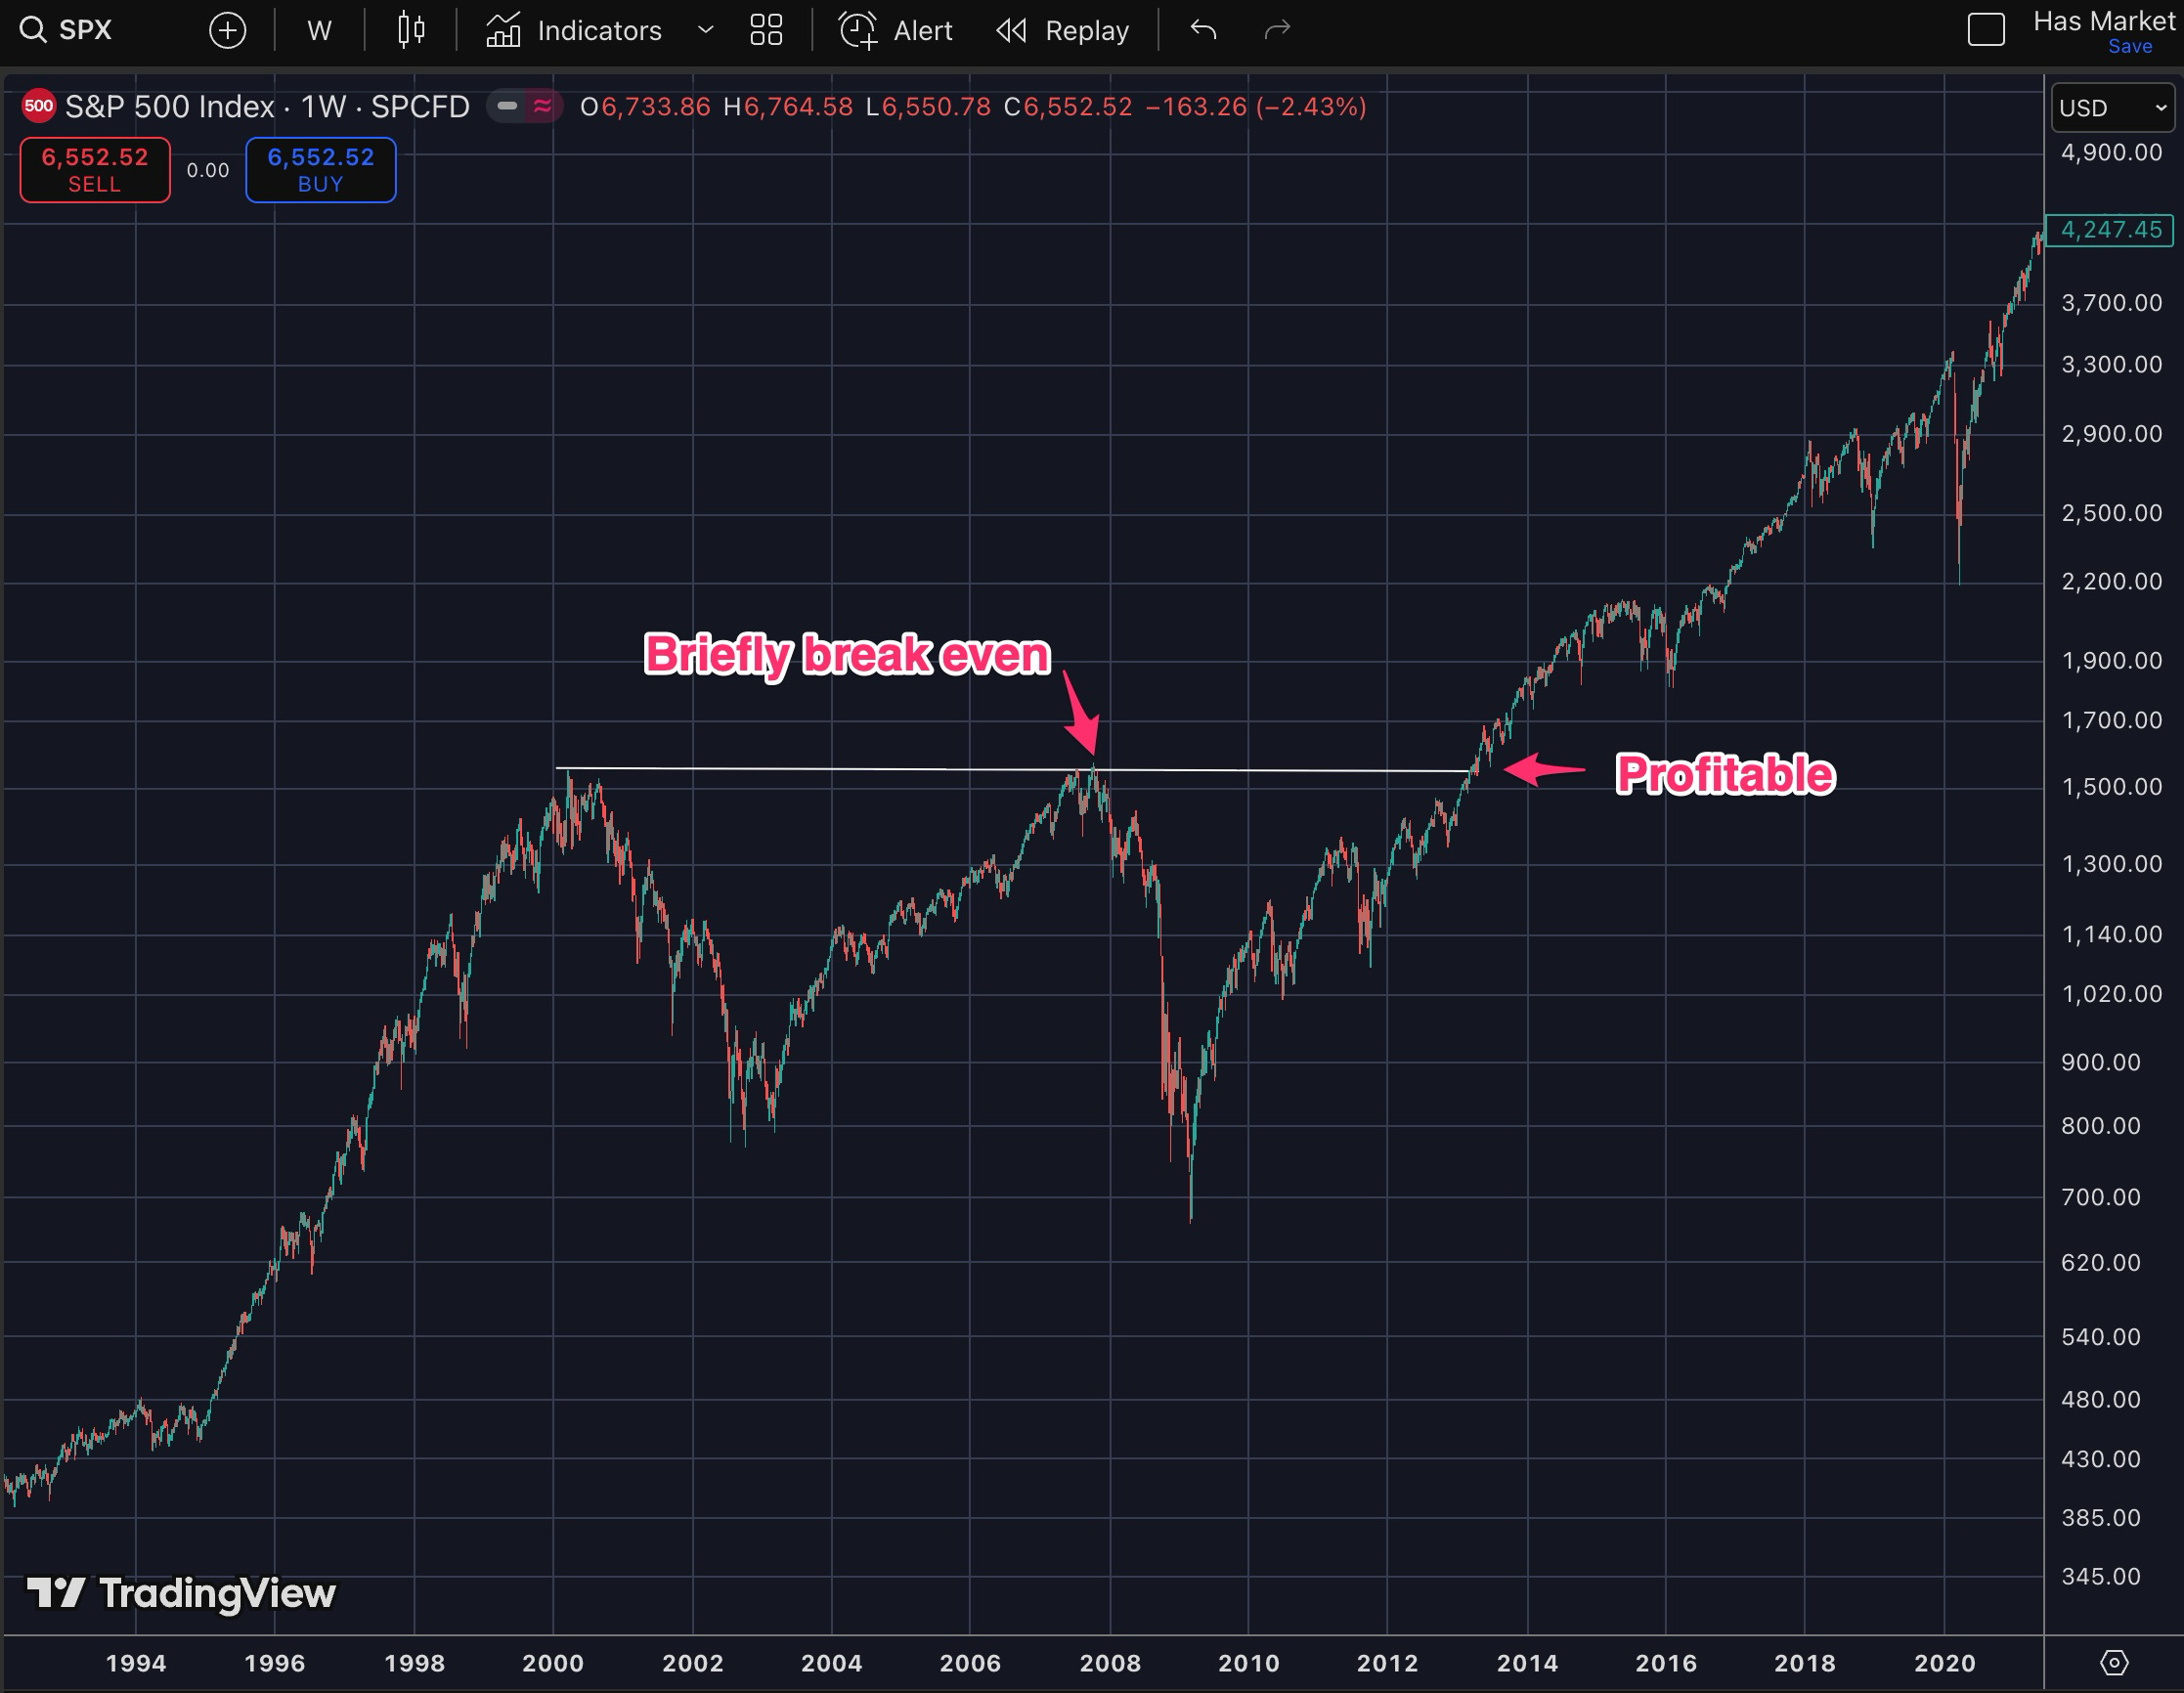
You would not be profitable until 12 years later!
And if you are to consider the “real” value of your investment (SPX/M2), then your bag would not have kept up with inflation, and it’s taken you 25 years to just return to it’s real value, adjusted for all the money printing the government has done!
I’m not trying to be bearish about the future, and I could be wrong. I’m just trying to give you the learnings without the scars!
4. Buffet index and cash reserve
No significant update here. Buffett indicator has continued to grow from 200% to 214% this last quarter.
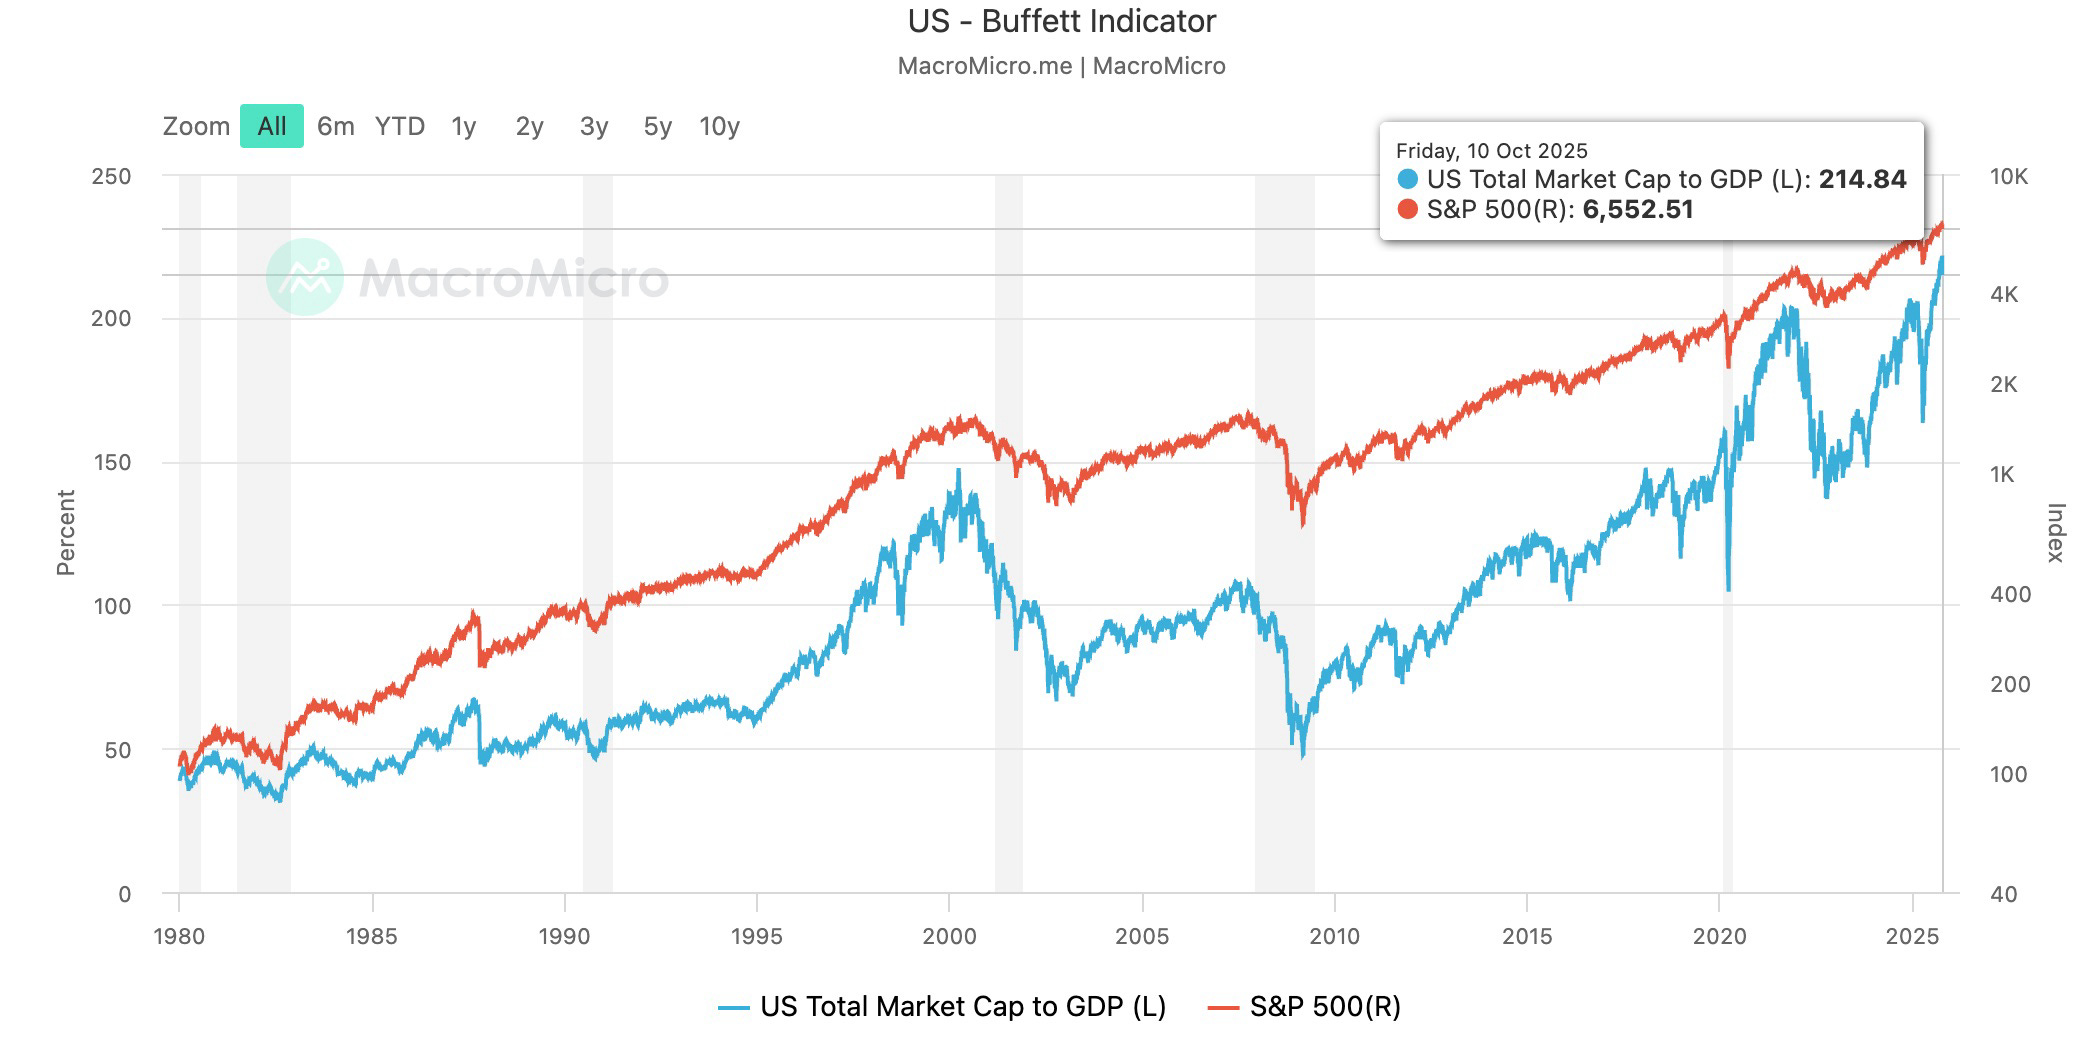
There’s no significant change to Berkshire’s cash reserve.
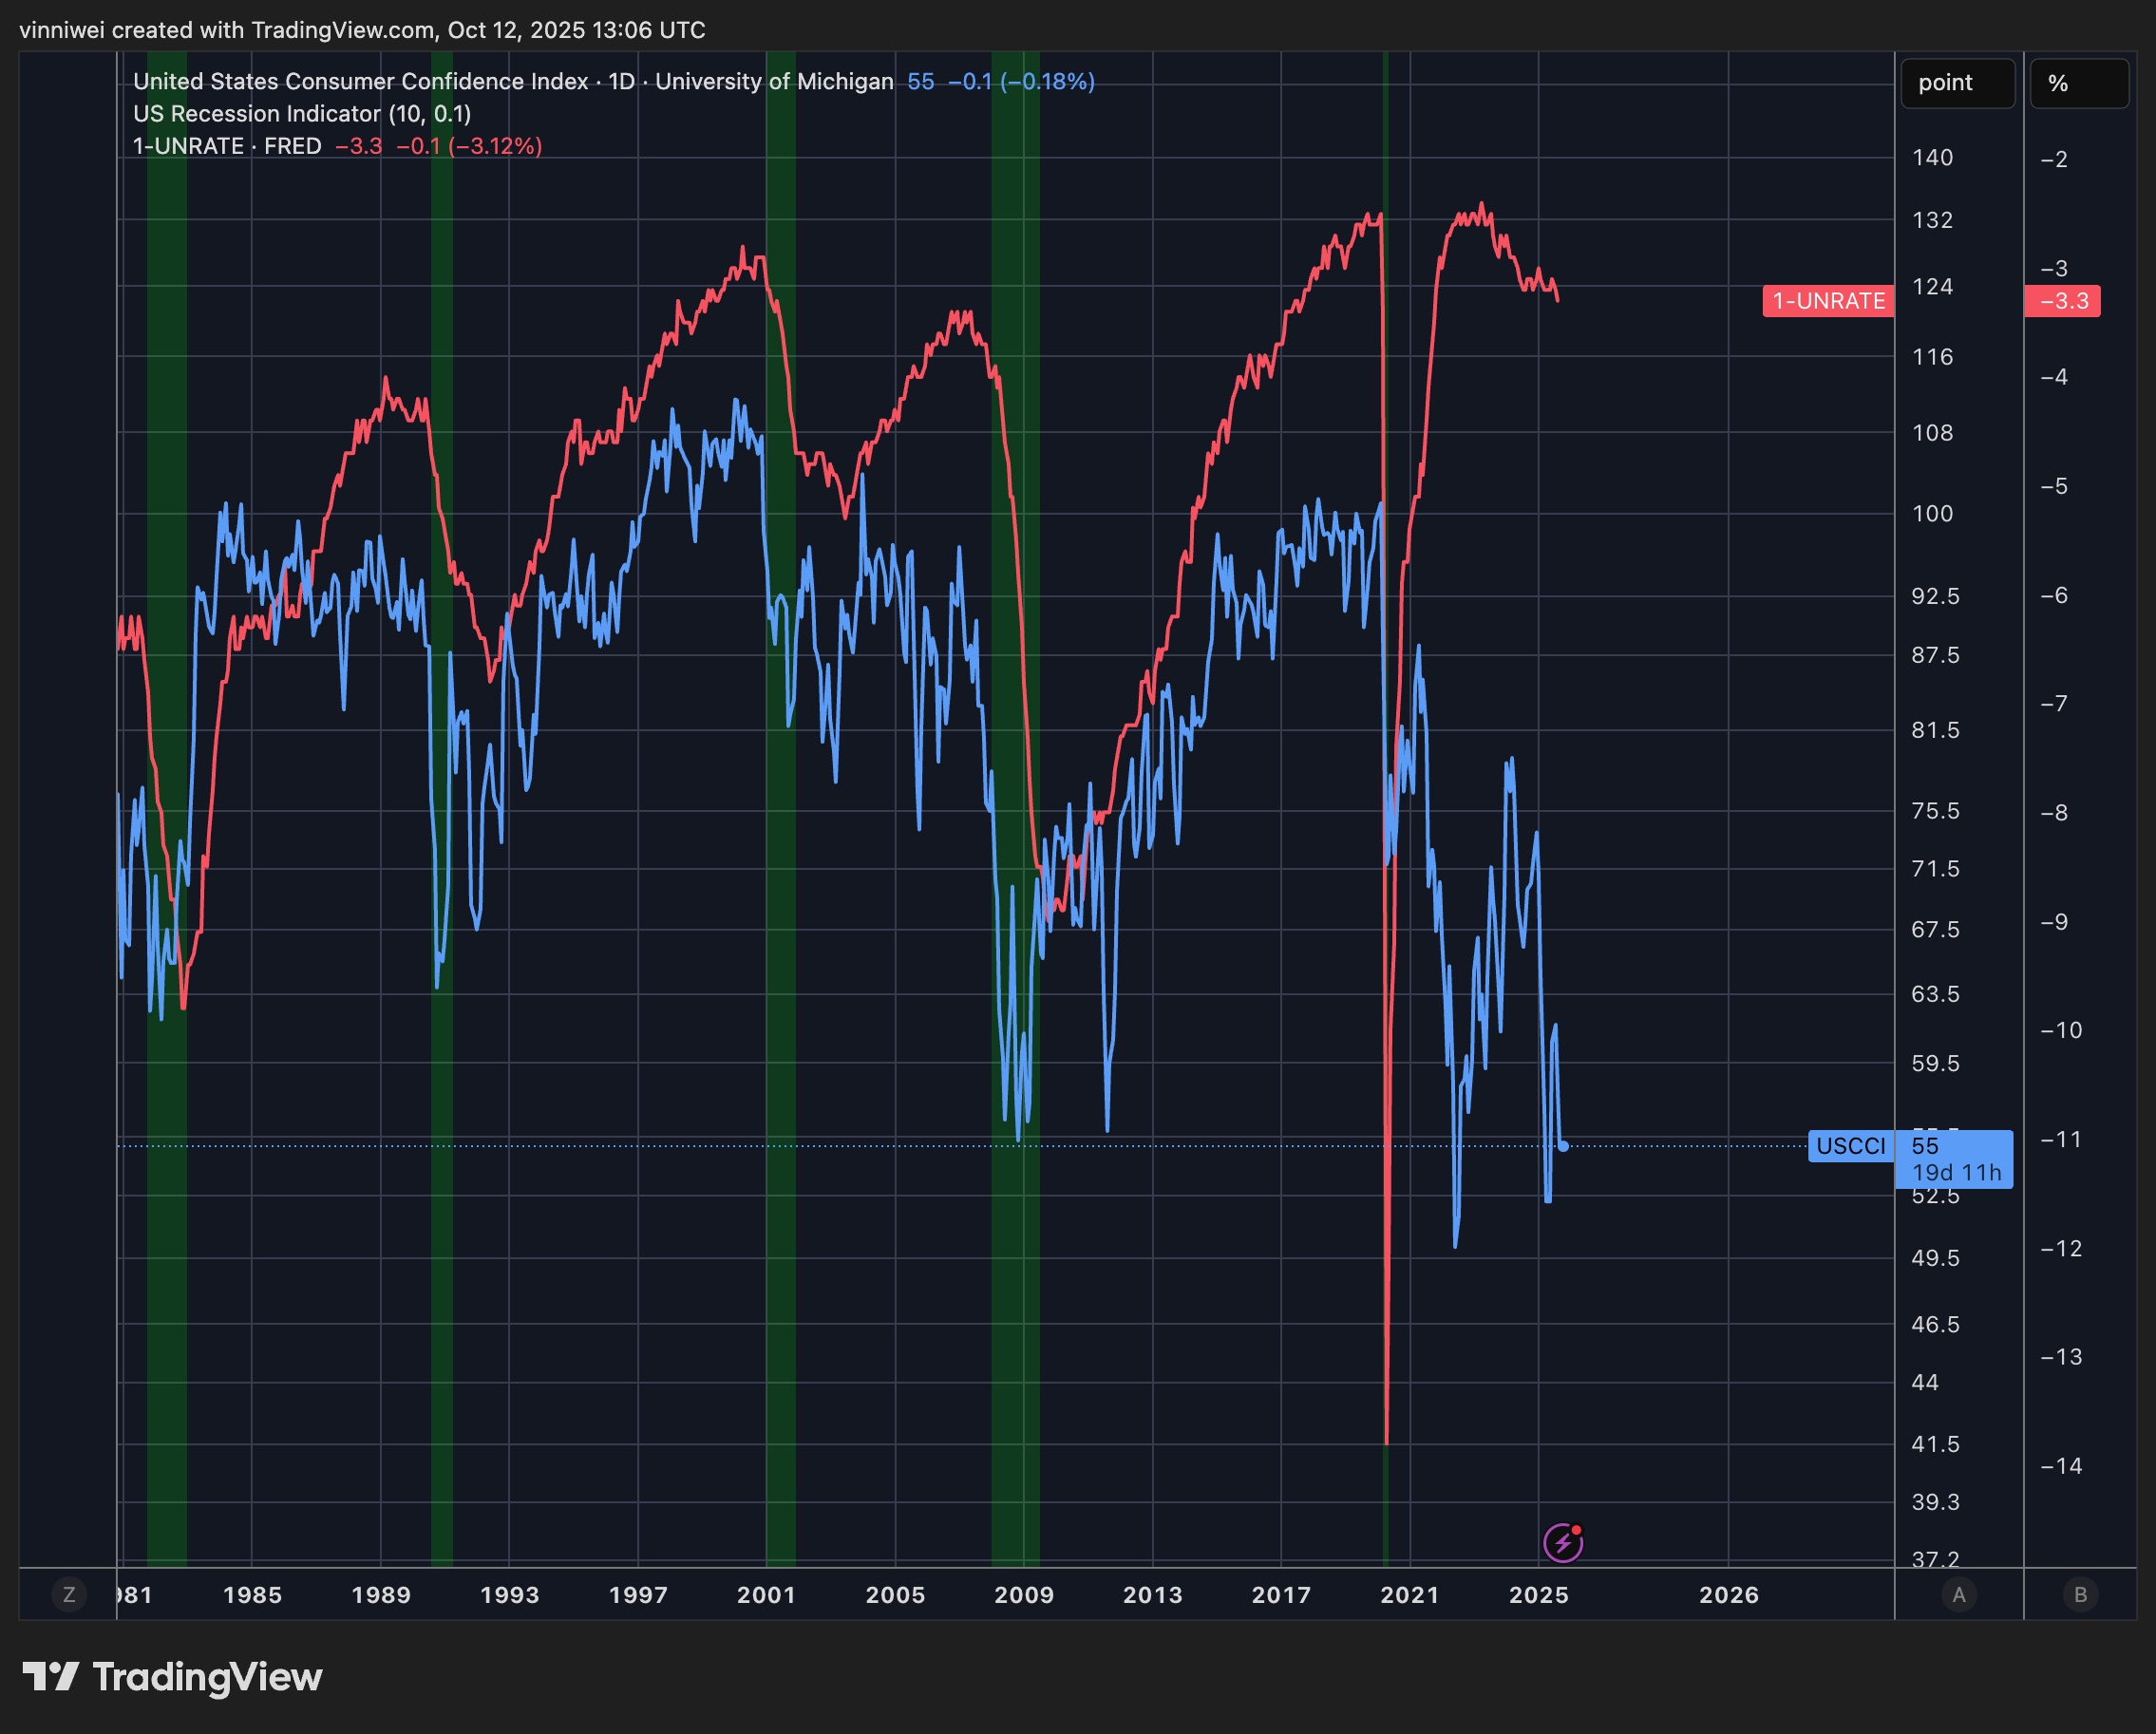
5. Unemployment and Consumer Sentiment
There’s an increase in unemployment rate and no significant change to cthe onsumer sentiment index (still being at recession level lows).
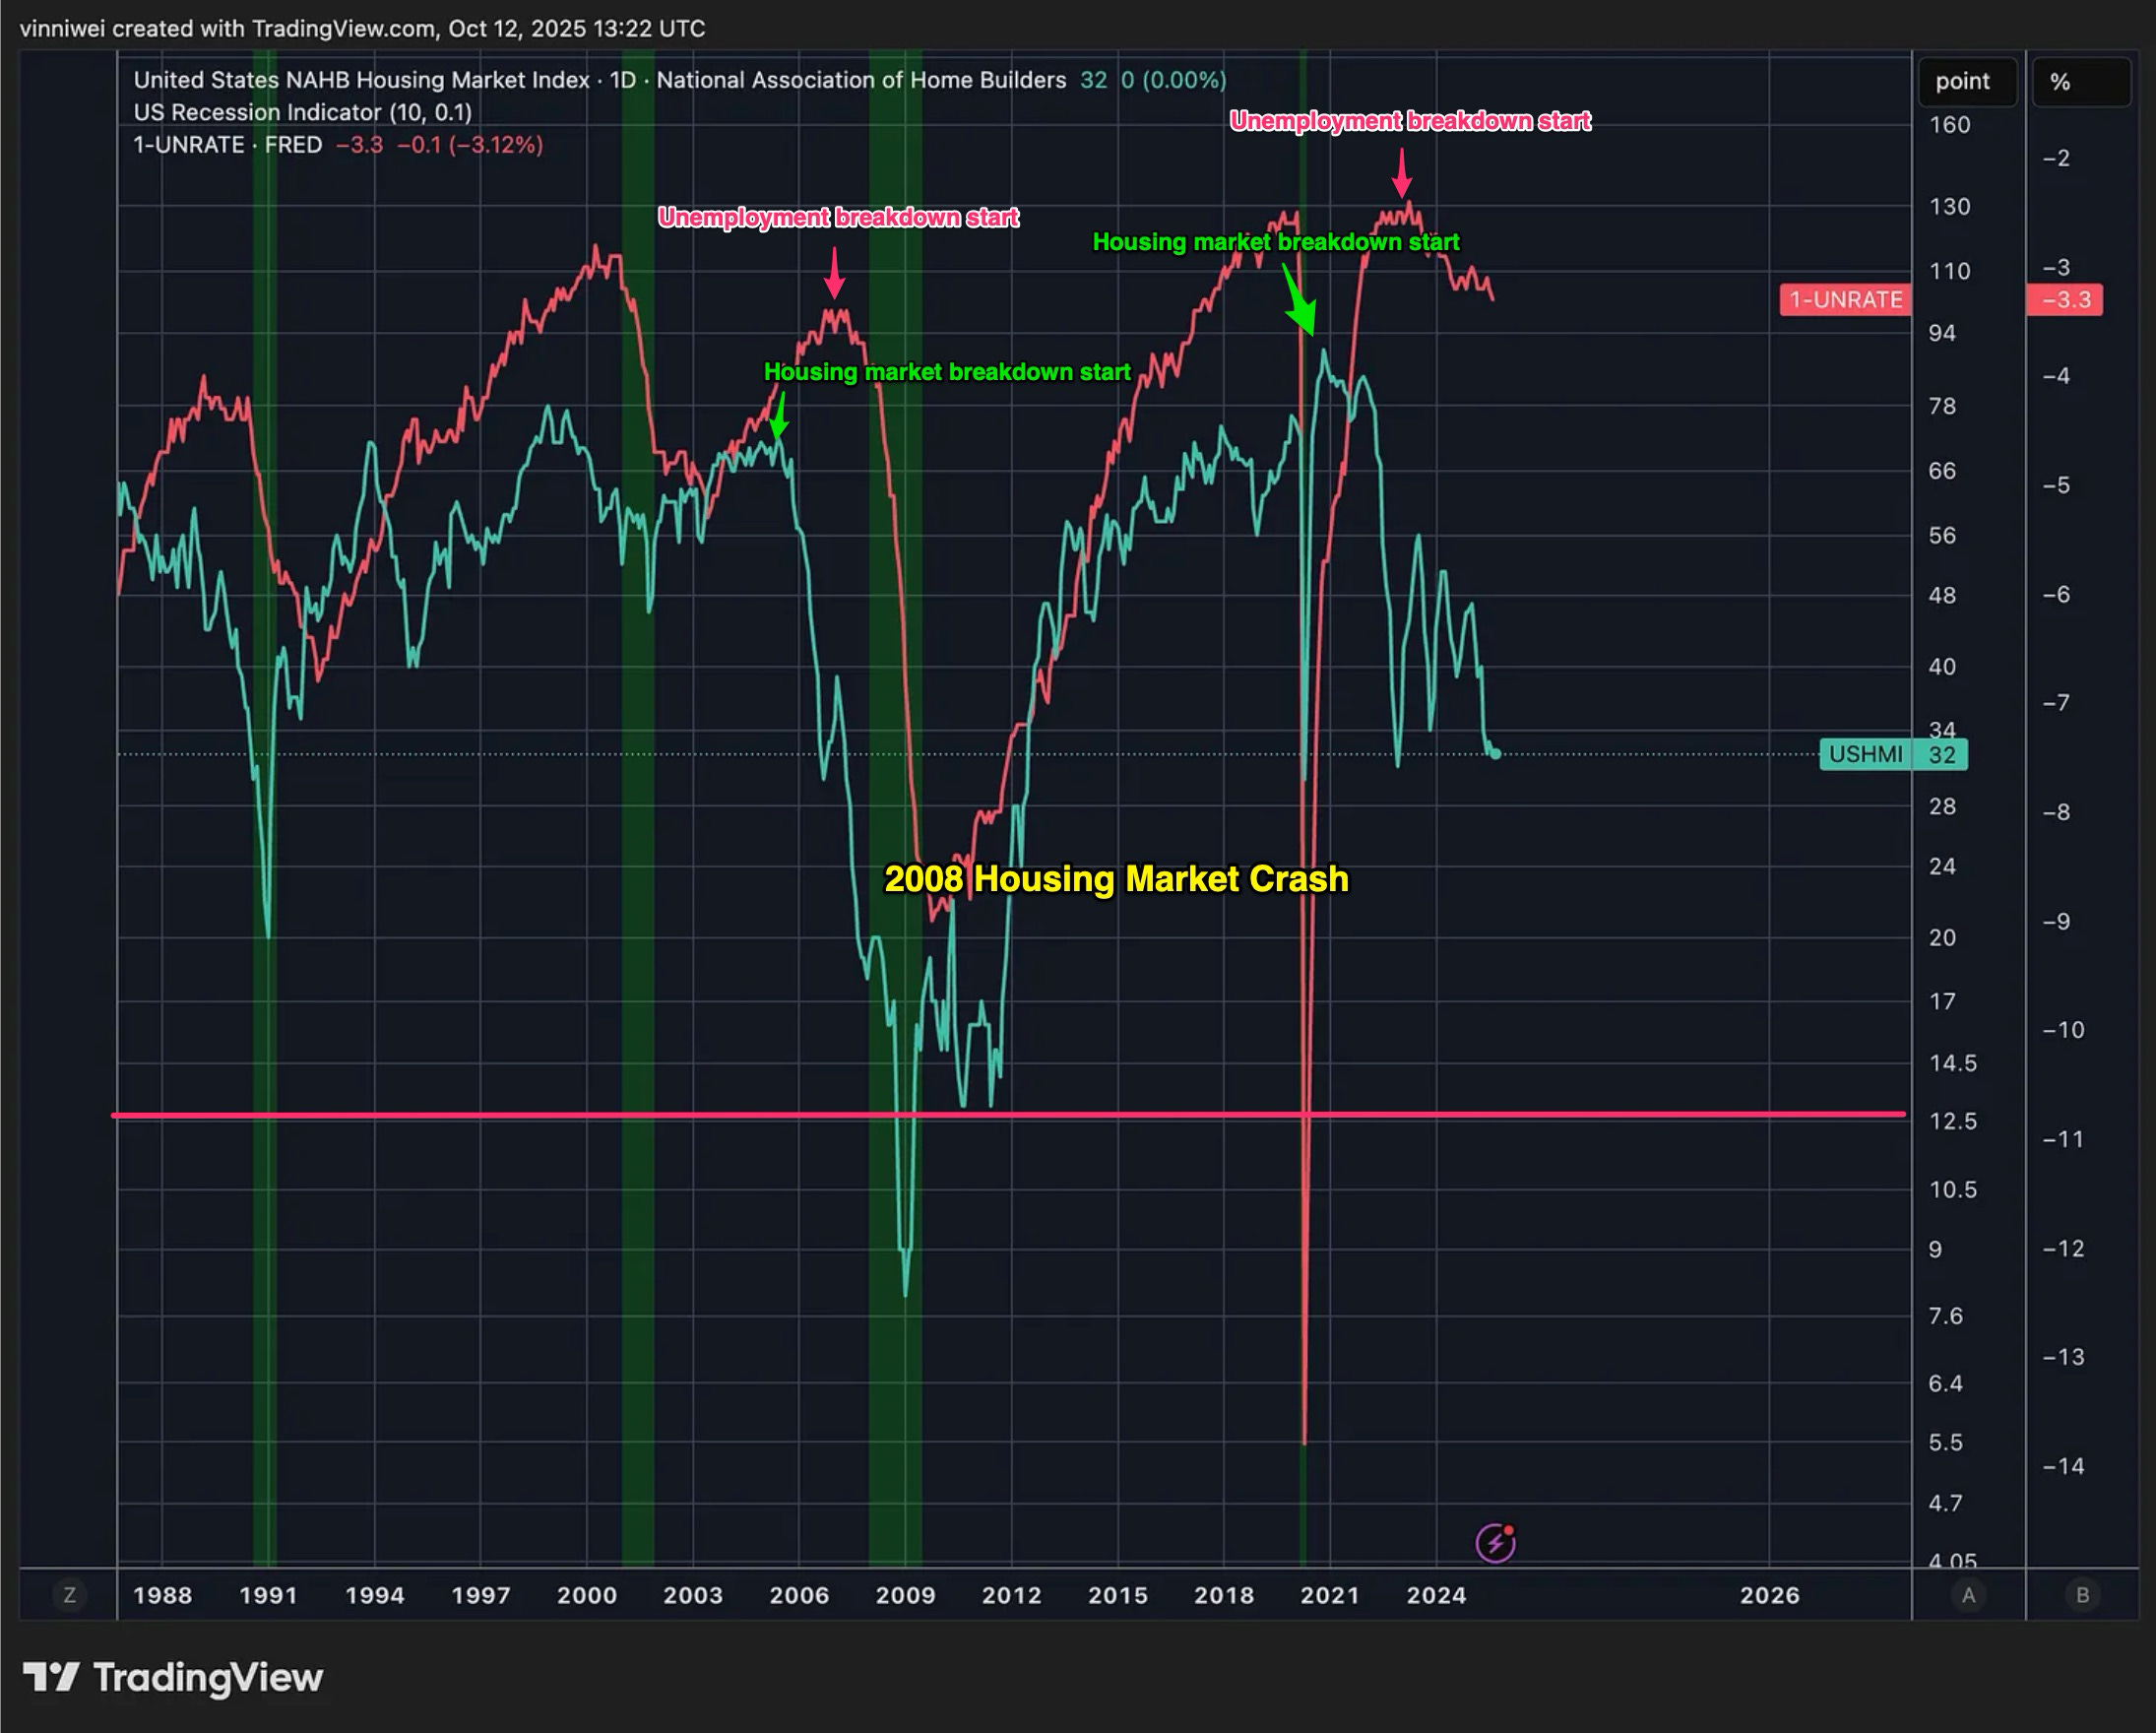
6. Housing Market Index
Quick refresher from last time: Housing cracks first when the economy weakens—it’s extremely sensitive to interest rates. Builders are forward-looking: they commit big money months ahead, so they pull back early when they see trouble. Historically, when builder confidence drops sharply, unemployment jumps about a year later.
There are no major changes to HMI. The data only comes in monthly, so it's not unexpected.
Conclusion
We never know where we’re going, but we sure as hell know where we are.
I’m not trying to make a forecast of what will happen in the next 6-12 months, because I think I’d be more likely wrong than right. But we’d sure be able to look at where we are now, and figure out what that implies for the future.
The thing you imply might not happen, but it is probably more likely to happen than not. We should think in terms of bets, be logical, and understand history and patterns.
It’s not about forecasting what’s next. It’s about getting the odds on our side.

Don’t risk what you have and need for something you don’t have and don’t need. It makes no sense for someone with a surplus of money to make their daily life less pleasant by going into investments that put them under pressure.
- Warren Buffett

And the riskiest thing in the world is to believe there is no risk. The risk in the market doesn’t come from companies, exchanges or institutions. It comes from people. For this very reason, when others are carefree, you should be terrified.
Because their behaviour raises prices.
When others are terrified, their behaviour surpasses prices and makes assets a giveaway.
Sooner or later, the market humbles us all.
Tread your own path.
Cheers,
Vin